Comment
Housing Delivery Test: Where are we in the north - 2020 update
At the end of November 2020, the Government published data confirming that there were 62,511 net dwelling completions across the north of England over the period 1 April 2019 to 31 March 2020, an approximate increase of 3,000 net dwellings compared to the previous year. Below we summarise the data and calculate an estimated Housing Delivery Test (HDT) figure for the 70 northern authorities.
Housing Supply: net additional dwellings, England: 2019 to 2020 presents estimates of changes in the size of dwelling stock in England due to house building completions, conversions, changes of use, demolitions and other changes to the dwelling stock.
The data shows that over the period 1 April 2019 to 31 March 2020, the north of England (the north west, north east and Yorkshire and the Humber) delivered its highest level of housing since 2007/2008. For the fourth year in a row, housing delivery in the north has exceeded the cumulative standard method requirement, with delivery in 2019-20 approximately 20,000 dwellings higher than the standard method requirement. This clearly illustrates the strength of demand for homes across the north.
The data is crucial for calculating the HDT which aims to identify those local authorities that have not delivered the necessary level of housing over the previous three years. The following consequences are imposed on local authorities who fail to deliver the necessary level of housing:
- Local authorities who deliver less than 95% of their housing requirement must prepare an action plan identifying measures to improve delivery.
- Local authorities who deliver less than 85% of their housing requirement are subject to a 20% buffer on their housing requirement.
- For 2019/2020 local authorities who deliver less than 75% of their housing requirement will be subject to the National Planning Policy Framework’s presumption in favour of sustainable development.
Estimated HDT figures for the northern authorities
Using the published housing figures we have calculated an estimate of the HDT figures for the 70 northern authorities (the HDT does not apply to National Parks), the results of which are presented below.
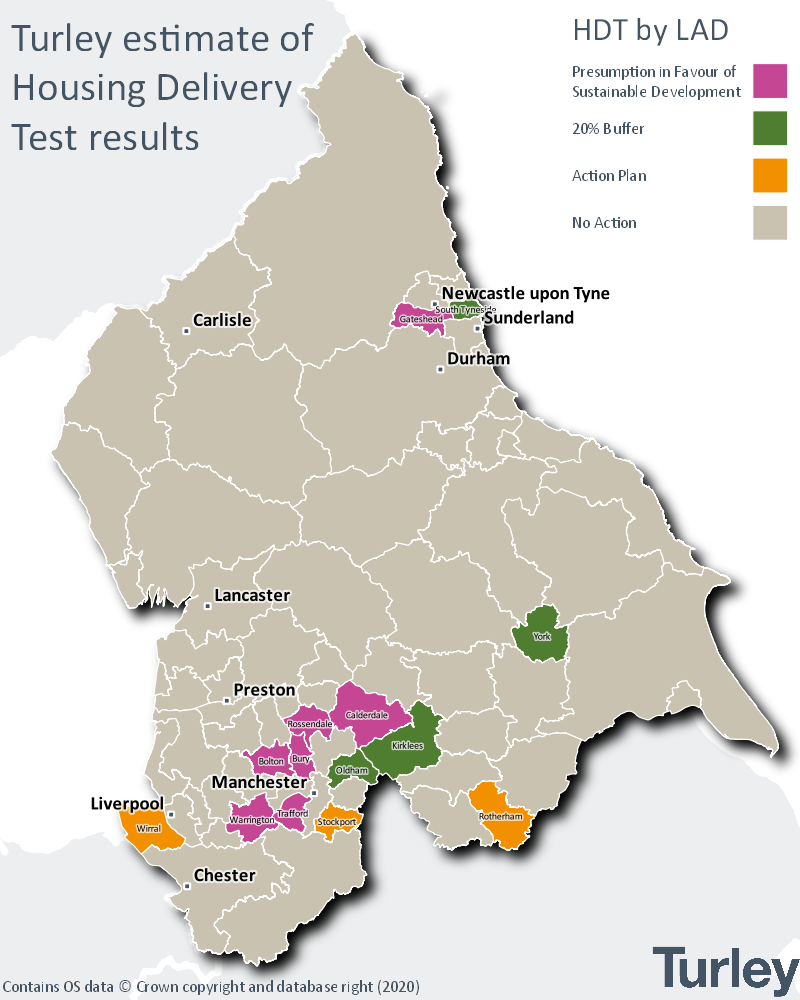
Our estimate indicates that seven of the 70 local authorities across the north of England have a HDT score that would impose the presumption in favour of sustainable development. This is a significant increase from 2018-19, when none of the northern local authorities were subject to the severest sanction. Whilst most of the local authorities who are likely to be subject to the strictest sanction delivered less housing in 2019-20 than 2018-19 (the only exception being Warrington), their delivery rates are not significantly different from the period 2018-19. The increase in the number of local authorities that will be subject to the presumption in favour of sustainable development therefore largely reflects the increase in the delivery threshold for the presumption in favour of sustainable development from 45% in 2018-19 [1] to 75% in 2019-20.
Four local authorities have HDT scores lower than 85%, and their housing requirements will be subject to a 20% buffer; a decrease from the 13 local authorities who were subject to this sanction following the 2018-19 HDT. A further three local authorities have HDT scores lower than 95% and will be required to produce action plans.
Our calculated HDT estimates for the northern authorities are available to download below.
Calculating the HDT, proposed changes to the standard method and potential implications
Delivery requirements for the HDT for the periods 2018-19 and 2019-20 are based on the local authority’s local housing need figure, calculated using the Government’s standard method or the figure in an up-to-date adopted Local Plan, whichever the lowest [2].
A large number of the northern local authorities do not have up-to-date local plans and their housing delivery requirements for the purpose of the HDT have therefore been calculated using the standard method for the periods 2018-19 and 2019-20.
Our HDT estimates show that the local authorities who are preforming well against the HDT are either those in rural areas, where the standard method requirement is low (such as Copeland and Richmond) or the strongly performing urban centres (such as Manchester and Salford). The data also shows that areas with recently adopted Local Plans also tend to perform well against the HDT (such as Cheshire East, and Cheshire West and Chester), whereas local authorities with very out-of-date local plans, particularly those with large Green Belt constraints (such as Bolton and Bury), tend to perform poorly. This highlights the importance for local authorities of getting a Local Plan in place in order to identify land supply for new homes. This is likely to be even more important in a post-pandemic economy, where it is anticipated that demand for suburban homes with gardens is likely to increase.
Following consultation on a new standard method calculation in the summer, the Government is expected to announce changes to the standard method imminently. The revised standard method consulted on in the summer would have resulted in the housing requirements for areas in the south east significantly increasing, but an overall reducing in the housing requirement in the north of England. This was heavily criticised by the development industry and other stakeholders, including those in local government, who argued that the revised standard method proposed in the summer consultation did not align with the Government’s message of “levelling up” the north. There was also backlash from more than 80 Conservative MPs who considered that it placed too much reliance on housing delivery in the south east. The implications of the final revised standard method are awaited, but it is anticipated that it will put increased focus on larger urban conurbations. Consequently, some local authorities may need to find ways of increasing delivery rates if they are to avoid future sanctions under the HDT.
If you have any questions relating to the HDT or the supply of housing in your area please contact Nick Graham or Paul Forshaw.
16 December 2020
[1] The lower threshold in 2018-19 reflected that the housing delivery test was new and was to enable a transition to the test.
[2] Unadjusted household projections were used to calculate the requirement for 2017-18 due to the standard method not being adopted at the time.