Comment
Surging affordability ratios increase housing need throughout most of England
The Office for National Statistics (ONS) released new affordability ratios for 2021 yesterday, updating a key component of the standard method for determining minimum housing needs in England.
Up-to-date figures for every local authority can be found in the latest version of our summary document, once again produced in collaboration with the Land Promoters and Developers Federation and available to download below.
The ratios continue to show the balance between median house prices and earnings in every local authority, the former having been calculated over the pandemic-affected year to September 2021. They starkly highlight the extent of widely-reported price rises throughout much of the country with all but eleven of the 308 local authorities in England – some 96% – having seen an increase in the median price paid for housing in their area compared to the year before. Only half, however, have seen a corresponding increase in median earnings.
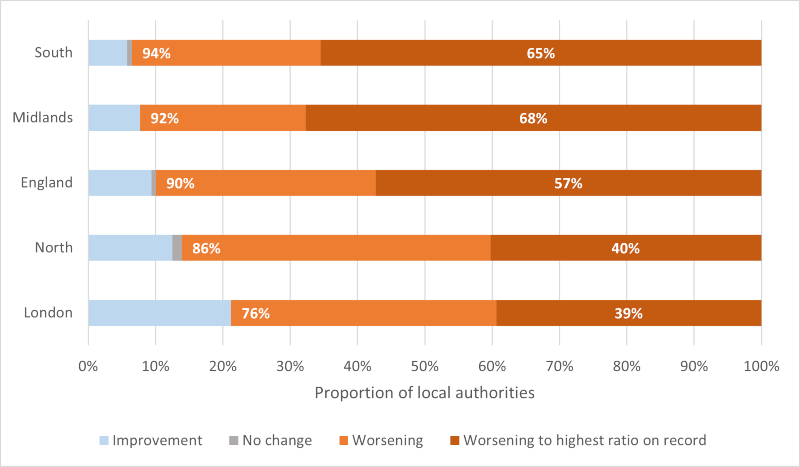
This has meant that there has been a year-on-year worsening of the affordability ratio in 90% of all local authorities in England, with similar trends apparent in every region as shown by Figure 1 below. Some 57% saw their ratios reach the highest level on record, this being particularly common across the Midlands and in the South outside London.
The standard method for assessing the minimum need for housing requires the immediate use of these ‘most recent’ ratios, which affect the scale of adjustment made to the baseline before a cap is applied and a further uplift is made in England’s largest towns and cities. The rises are so pronounced that they add nearly 7,700 homes to the total national need, which now approaches 305,000 dwellings per annum.
Some 71% of local authorities now face planning for a higher minimum need, compared to figures calculated using ratios that have been superseded with yesterday’s release. The cap somewhat tempers the impact of higher ratios in London and the South, where many areas were already applying the maximum 40% uplift permissible under the method – this contributing towards 25% of all local authorities, the vast majority located in these regions, seeing no change in their housing need – but some 92% of authorities in the Midlands and 83% of those in the North have seen increases. The largest proportionate increases in minimum housing need have been seen in Melton (16%), West Devon (16%) and Dover (12%) but a further 67 have seen increases of at least 5%.
Please contact Andrew Lowe or Antony Pollard for more information.
24 March 2022