Comment
Improving affordability ratios should not mask near-record highs in much of England
The Office for National Statistics (ONS) released its annual update to affordability ratios on 22 March, providing an updated position on how house prices – over the year to last September – relate to earnings in every local authority in England.
While this new data immediately affects the minimum need calculated using the standard method, as we explain below, it is still the case that the national figure supports – and indeed exceeds – the Government’s target of 300,000 homes per annum.
Looking beyond the headline
The headline, for the country as a whole, suggests that housing became more affordable compared to earnings last year. The average (median) home in England cost the equivalent of 8.3 years’ earnings, compared to 9.1 years – a record high – in 2021. The ONS describe this as ‘a return to the long-term trend’ after prices increased in 2021, fuelled by ‘increases in the volume of sales and changes in Stamp Duty Land Tax and Land Transaction Tax’[1].
Most areas followed the national trend and saw their affordability ratios fall, with 72% of all local authorities seeing improvements and a further 2% seeing no change. This does mean that 81 local authorities – more than one in four (26%) – saw a worsening of affordability, reminding us why it is always important to look beyond the national headline.
At the regional level, it is apparent that some 39% of London boroughs saw affordability worsen, as did 30% of local authorities elsewhere in the South. The same was true of 20% of local authorities in the Midlands and 19% of those in the North.
Unprecedented issues remain in many areas
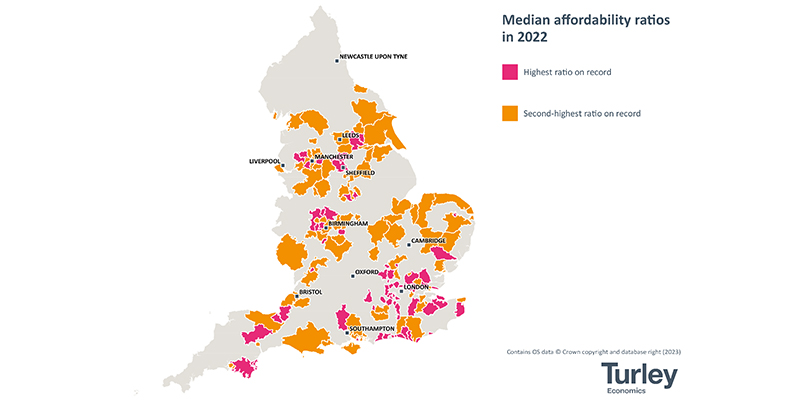
So, where does this leave us? While housing is reported to have become more affordable at the national level, it should not be forgotten that the latest ratios represent record highs in 61 local authorities, equivalent to roughly one in every five (20%). A further 85 authorities have seen higher ratios only once since 1997, meaning that affordability is at – or close – to record levels in 146 of the 309 local authorities in England. That is almost half (47%).
This figure rises as high as 53% across the South, excluding London, and similarly exceeds half in the Midlands (52%). Some 38% of local authorities in the North have also received their outright, or second, highest ratio since at least 1997. The equivalent figure for London is 33%. This clearly demonstrates that vast parts of England are facing affordability issues that are largely without local precedent, reinforcing the severity of the national housing crisis.
Effect on the standard method
The new ratios have an immediate impact because they feature in the standard method of assessing housing need, determining the scale of adjustment that is made to the baseline before a cap is applied and the figure is further uplifted in England’s 20 largest towns and cities.
Our summary document, produced once again in collaboration with the Land Promoters and Developers Federation and available to download below, shows how the new ratios affect the outcome of the standard method in each local authority. While over half (52%) now have a lower starting point than would have been the case even yesterday, it is important to recognise that the reductions are generally modest, averaging only 2.8%. Some 78 authorities see increases of 1.9% on average, and the remaining 70 see no change having either received an identical ratio or one that would again require an uplift larger than is permitted by the standard method, with the 40% cap negating the impact of new ratios in those cases. The modest nature of these changes means that the national figure remains consistent with the Government’s target of delivering 300,000 homes per annum, and indeed exceeds this by c. 3%.
Please contact Andrew Lowe or Antony Pollard for further information.
24 March 2023